Skip to content

data analyst — data management & visualization

Turning Data into
Insights that Matter.

I'm Sherjames Compania, an entry-level Data Analyst focused on data preparation, analysis, reporting, and visualization. I mainly use Excel, SQL, and MySQL for working with data, along with Tableau and Power BI for reporting and visualization.

Profile // 01
Portrait of Sherjames Compania
Sherjames Compania
DATA ANALYST · DATA MANAGEMENT & VISUALIZATION
ExcelSQLMySQLPython TableauPower BIJupyter NotebookNotion
Sherjames Compania working at his desk
Negros Occidental,Philippines
EducationB.S. Computer Science -
Central Philippine University
Iloilo City, Philippines
June 2025
FocusData entry, cleaning,visualization & reporting
StatusOpen to entry-level DataAnalyst roles

About Me

I graduated with a B.S. in Computer Science, with a major focus on Data Science, from Central Philippine University. My first experience building a real dashboard came during my IT internship at a BPO company. I was given an Excel file containing a list of damaged equipment from different campaigns for a specific month. My supervisor asked me to build an interactive Power BI dashboard that he could present in a meeting the following day. I started by using Excel Power Query to clean, organize, and prepare the dataset before bringing it into Power BI, where I built the dashboard and turned the raw records into something easier to understand and present.

I also work as a freelance AI Trainer and Data Annotator for Mindrift, a Boston Consulting Group platform. My work involves reviewing AI-generated responses, comparing different outputs, and identifying patterns in the mistakes models make.

Most of what I enjoy about data work comes down to the small details. Cleaning up a dataset, finding inconsistencies, checking whether the numbers make sense, and presenting the results in a way that's easier to understand and use.

Link to my Socials

Featured Projects

A focused gallery of data projects showing how I clean, analyze, visualize, and report information using practical analytics tools.

Philippine Labor Market Case Study dashboard thumbnail

Project // 01

Philippine Labor Market Analysis: COVID-19 Impact, Gender Differences, and Post-Pandemic Recovery (2016–2025)

A data analysis that examines how the COVID-19 pandemic affected the Philippine labor market from 2016 to 2025, using labor force, employment, and unemployment data. It tracks the shock and recovery, compares outcomes by gender, and evaluates whether the labor market has recovered to or surpassed pre-pandemic levels.

ExcelPower QueryPivot Tables & Charts
Payroll and Workforce Analytics dashboard thumbnail

Project // 02

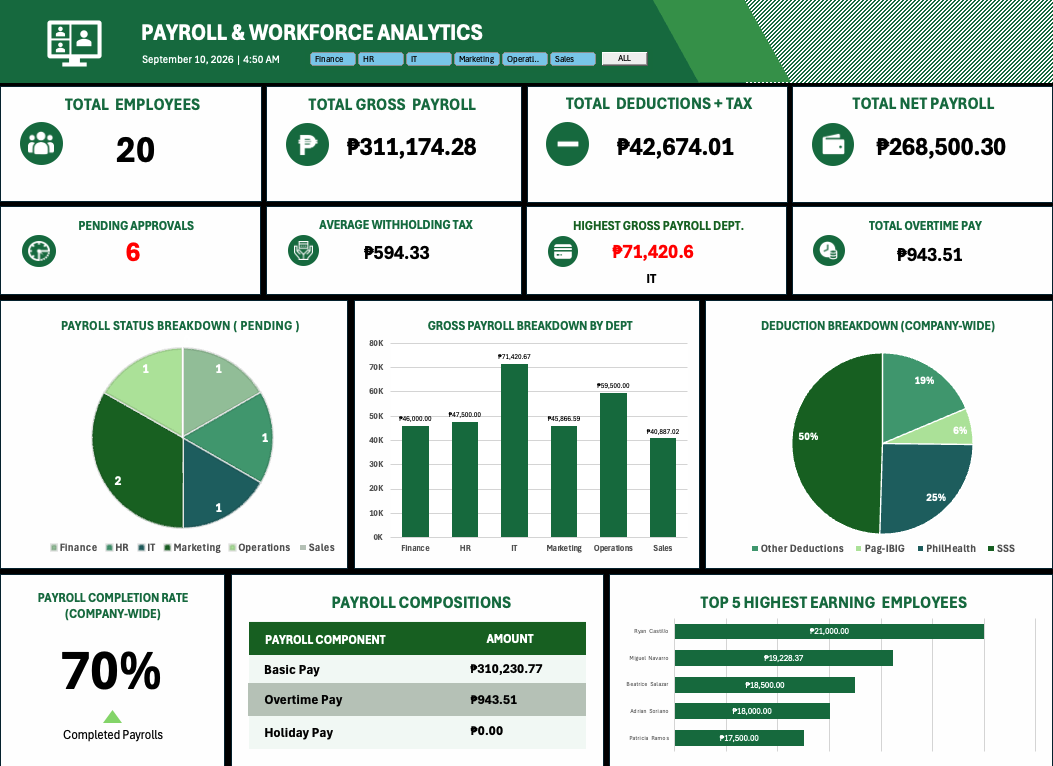
Payroll & Workforce Analytics System

An Excel-based payroll workbook that brings together employee records, attendance, pay, deductions, taxes, payslips, and a dashboard for reviewing company payroll results. It also includes a simple filter-reset macro and an instant employee payslip view.

ExcelPivotTablesDashboardVBA
R Excel Power BI
sample dashboard visual

Project // 03

E-commerce sales and customer insights

A mock analysis of sales performance, product categories, repeat customers, and regional revenue to identify growth opportunities and customer behavior patterns.

SQLTableauExcel
monthly spending trend

Project // 04

Personal finance trends dashboard

A mock reporting dashboard that categorizes expenses, compares monthly budgets with actual spending, and highlights recurring patterns through simple visual summaries.

PythonExcelVisualization

Relevant Experience

Feb 2026 — Jul 2026

AI Trainer / Data Annotator

Mindrift (Boston Consulting Group) · Freelance, Remote

  • Evaluated and annotated AI-generated text responses for accuracy, coherence, and relevance based on structured task guidelines.
  • Conducted comparative analysis between multiple AI outputs to rank quality and provide structured feedback.
  • Applied data analysis skills to identify patterns in model errors and inconsistencies across annotation tasks.
Jan 2025 — May 2025

IT Intern

TruAlliant BPO Inc., Iloilo City

  • Managed and organized an Excel dataset to track damaged equipment by campaign, then built a Power BI dashboard to visualize the data.
  • Troubleshot and resolved basic hardware and software issues on computers used by call center agents.
  • Conducted daily morning inspections across production rooms and communicated findings to the supervisor.
  • Processed employee resignation document requests and assisted with fingerprint registration during an attendance system upgrade.

Skills & tools

What I use most in day-to-day data work.

Data analysis

Data CleaningData Entry Data FormattingData Visualization

Data tools

ExcelSQLMySQL PythonJupyter Notebook TableauPower BI

Workflow & productivity

NotionClickUp ZapierClaude

Core competencies

Attention to DetailProactive Problem-Solving Organization & Time ManagementProfessional Communication AdaptabilityCritical Thinking

Have a dataset that needs a closer look?

I'm open to entry-level Data Analyst roles and freelance data work — cleaning messy datasets, building dashboards, or annotating data for AI training.