Setup
Rates, holidays, deduction types, and notes explain the rules used by the workbook.
PROJECT 02 · EXCEL PAYROLL DASHBOARD
An Excel payroll workbook that tracks employees, attendance, pay, deductions, taxes, payslips, and company results in one place.
Role
Excel setup · calculations · dashboard design
Tools
Microsoft Excel · PivotTables · Charts · VBA
Scope
Fictional Philippine payroll cycle · 20 employees
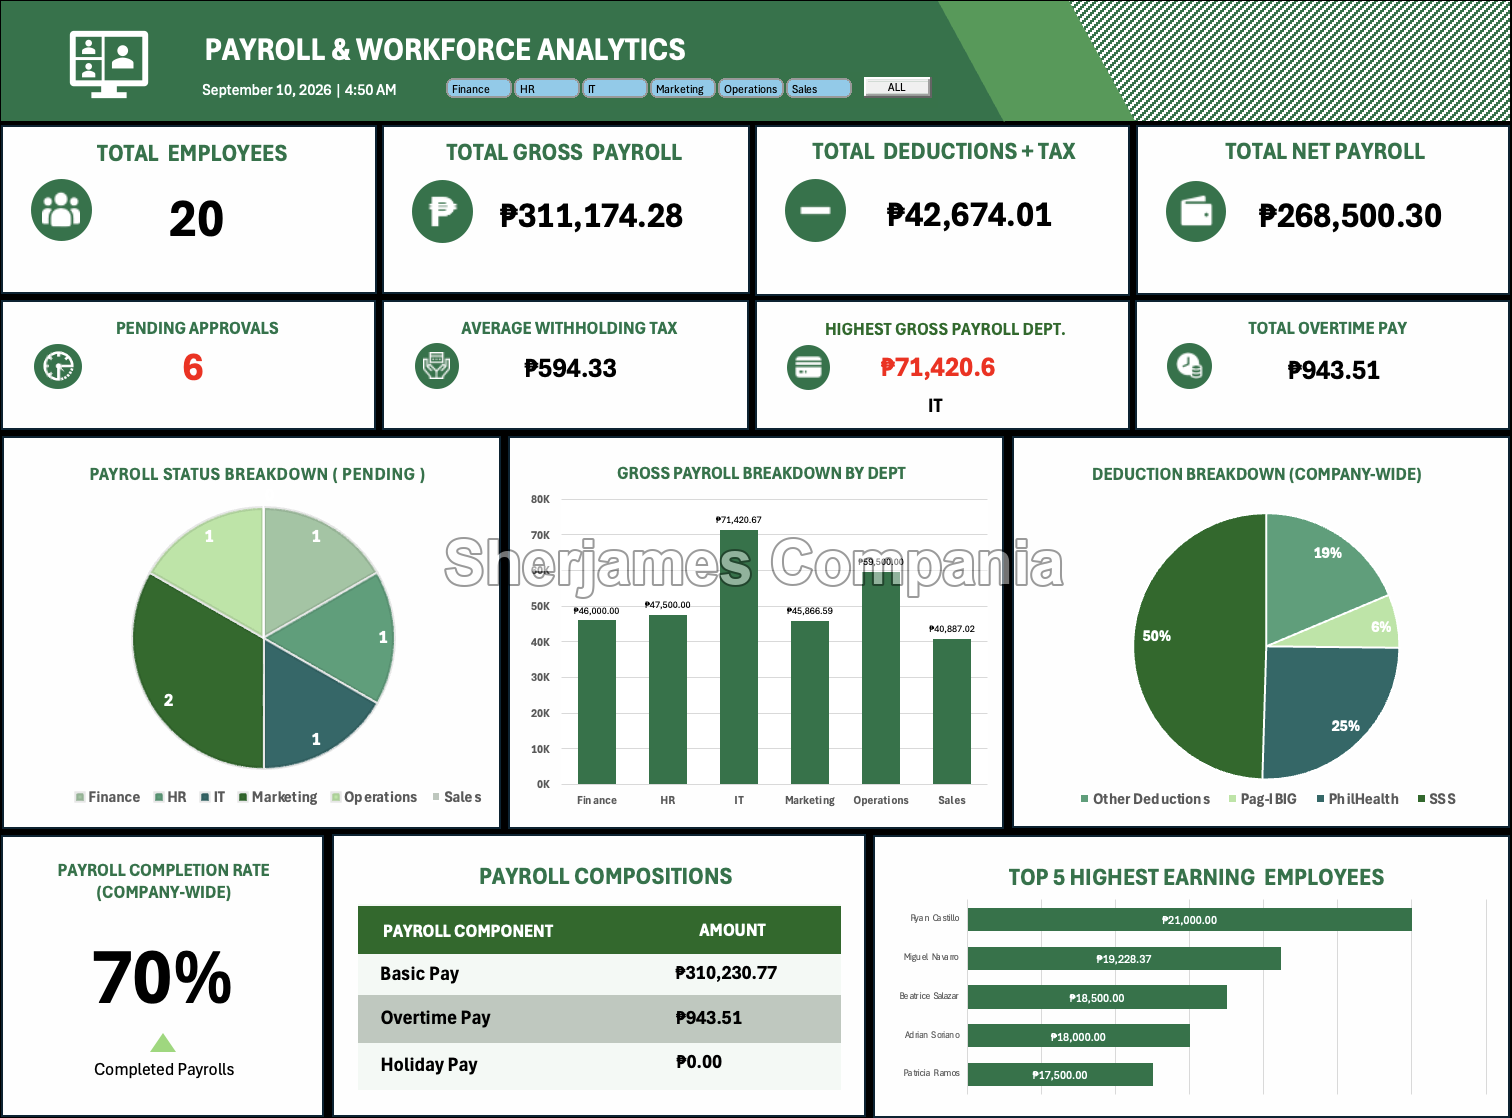
The dashboard shows the main payroll numbers, department totals, deductions, payroll status, pay components, and highest-paid employees in one view.
The Payslip sheet pulls one employee’s records into a clear semi-monthly statement. The screenshot and recording show how the selected employee’s pay details update in the workbook.
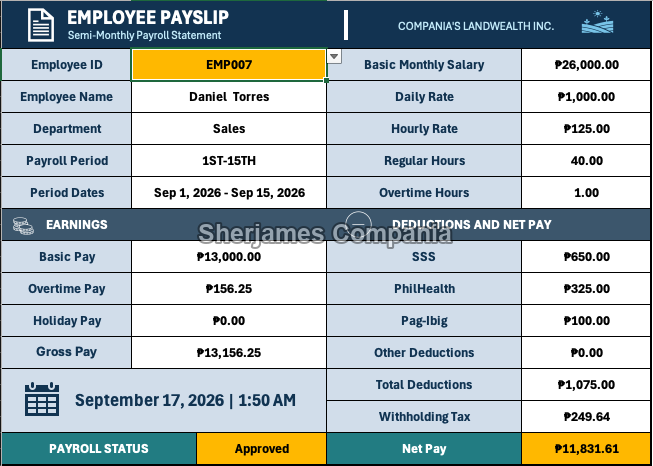
Semi-Monthly Payroll Statement
COMPANIA'S LANDWEALTH INC.
September 1–15, 2026
| Employee ID | EMP007 | Employee Name | Daniel Torres |
| Department | Sales | Payroll Status | Approved |
| Basic Pay | ₱13,000.00 | Overtime Pay | ₱156.25 |
| Holiday Pay | ₱0.00 | Gross Pay | ₱13,156.25 |
| SSS | ₱650.00 | PhilHealth | ₱325.00 |
| Pag-IBIG | ₱100.00 | Withholding Tax | ₱249.64 |
| Total Deductions | ₱1,075.00 | Net Pay | ₱11,831.61 |
The workbook was made to show how a small company could manage payroll in Excel. The main figures are calculated automatically, and the reports update from the same payroll data.
The workbook moves from employee and attendance records to payroll, payslips, and dashboard reports. A separate Rates sheet keeps contribution rules, pay multipliers, and tax brackets in one easy-to-update place.
The workbook is split into four simple parts, each with a clear job.
Rates, holidays, deduction types, and notes explain the rules used by the workbook.
Employee details, attendance, leave, and deductions are entered here.
The workbook calculates earnings, contributions, tax, deductions, and take-home pay.
Payslips, tables, charts, filters, and dashboard cards present the results.
Each feature keeps the payroll process easier to update, check, and explain.
The Employees sheet is the main list. Other sheets use the Employee ID to bring in the right name, department, and pay details.
Attendance and deductions are counted using the selected payroll start and end dates, so the next pay period can be prepared quickly.
Contribution rates, overtime pay, holiday pay, and tax brackets are kept on the Rates sheet instead of being spread across many formulas.
The dashboard reads from the summary tables, so the cards and charts stay aligned when a department filter is used.
A small VBA macro clears the Department filter and returns the dashboard to its full-company view.
The records are fictional and the rates are examples. This is a portfolio project, not a production payroll system.
The workbook is a working demo, so a few parts would need more work before real company use.
The sample covers only a small number of days for demonstration. Holiday pay would be more reliable with a full-year holiday calendar and more attendance records.
Contribution rates and tax brackets are examples based on known Philippine rules. They should be checked against current official rates before use.
The employee and attendance records are fictional and limited in size. More records and edge cases would help test the workbook further.
Future versions could include night differential, undertime, unpaid leave, multiple payroll periods, bonuses, and more holiday types.
Input warnings, approval steps, error checks, and locked formula cells would make the workbook safer to share.
A production version would need updated rules, access controls, data backups, and a formal review by payroll or HR staff.
Explore the Excel workbook, supporting files, dashboard examples, payslip demo, and project documentation on GitHub.
Dataset: Self-generated and fully fictional — 20 employees and 100+ attendance records. Employee names, government IDs, bank details, attendance logs, and contact information are portfolio-only examples. Payroll rates and tax brackets are examples based on publicly known Philippine rules and have not been validated for production use.
This workbook was built as a self-directed exercise to practice Excel, payroll reporting, dashboard design, and simple automation skills relevant to payroll and HR analytics roles.